
Heart rate is a wonderful physiological marker that allows us to accurately monitor the stress we are inducing on the body. We use heart rate because it is simple but in reality heart rate is a proxy for other physiological markers we’re trying to improve with our training. For many athletes, this will be your lactate threshold which is the point at which lactate starts to accumulate in your blood at an accelerated rate. Push beyond your lactate threshold and you’re on a limited clock before fatigue will slow you down.
The most accurate way to calculate lactate threshold is to measure lactate. This is generally done in a lab with what is called a step or graded exercise test where you gradually increase the intensity of exercise until you reach exhaustion. A small amount of blood is taken (usually from the earlobe) at regular intervals to measure lactate.
When we measure lactate in the lab, there are generally two inflection points of interests, often referred to as lactate turn points.
Lactate Turnpoint 1 (LT1) is the point at which there is a measurable rise in blood lactate above baseline. Depending on the literature, this could be .5 mmol/L above baseline, 1mmol/L above baseline, or the last point at baseline before a rise was detected. You can start to see why there is some confusion around this terminology. Generally, LT1 is somewhere around 2mmol/L and is also called our aerobic threshold. Aerobic threshold is also confusing nomenclature because we can and do produce aerobic energy above and below this point, but I unfortunately wasn’t consulted when these things were named.
Lactate Turnpoint 2 (LT2) is the point at which lactate starts to rise at an accelerated rate. This is generally around 4mmol/L of blood lactate although it can vary and is also called our anaerobic threshold or simply our lactate threshold. Again, the nomenclature is a bit murky, so let’s just call them LT1 and LT2. But so you understand the street lingo:
LT1 = aerobic threshold
LT2 = anaerobic threshold
If we plot these on a graph with lactate on the y-axis and heart rate on the x-axis, it would look something like this. Notice how after LT2, lactate goes through the roof.
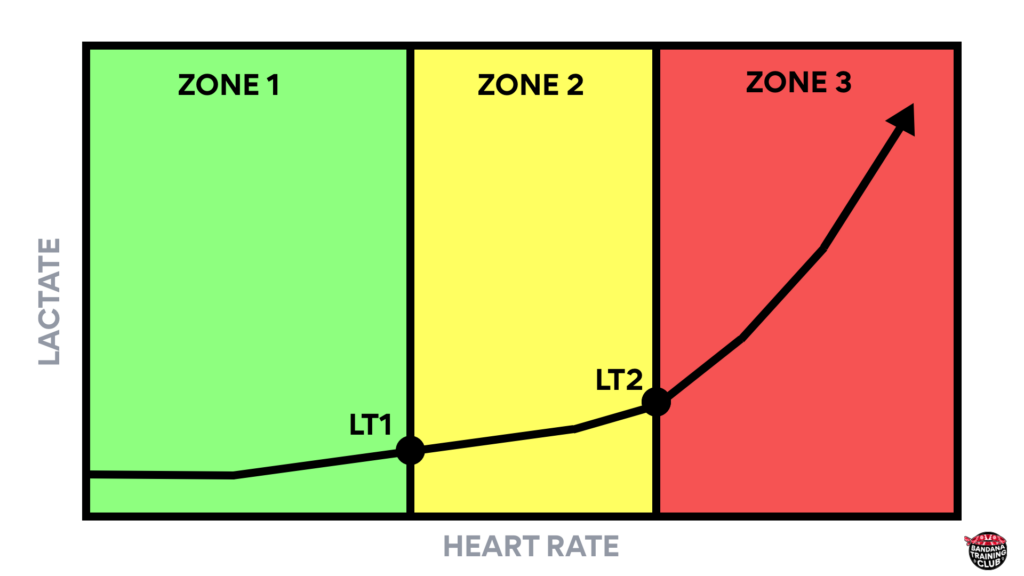
Not bad! We’ve got a 3 zone system established based on physiological makers which is a nice starting point.
Let’s add a few more physiological markers to the top and bottom of our graph. Up first our V02 max.
V02 max is the maximum amount of oxygen we are able to utilize during intense exercise. Remember, we can produce energy beyond our V02 max but that energy is exclusively anaerobic. V02 max is also measured in a lab with athletes running on a treadmill or a cycle-ergo while connected to a machine that can analyze expired air. Most athletes love this test because it looks like a gatorade commercial, however it is a maximum effort test so prepare accordingly.
Let’s add one more physiological marker to our graph on the low end. Generally speaking when we’re training in low zones, we want to make sure we’re working out at an intensity that elicits some sort of adaptation. If it’s too easy, it is more accurately considered recovery work which is essential to a complete training program, but should be distinguished from the training zone intended to improve our aerobic capacity. To be honest, most athletes need to reminded to slow down (not speed up) when they’re training in low zones but let’s still include a breakpoint here. For trained athletes, 60% of max HR is going to feel like a walk in the park (literally). In fact, if you’re running, you might simply divide these zones between walking and jogging – so Zone 1 is a walk and Zone 2 is a jog.
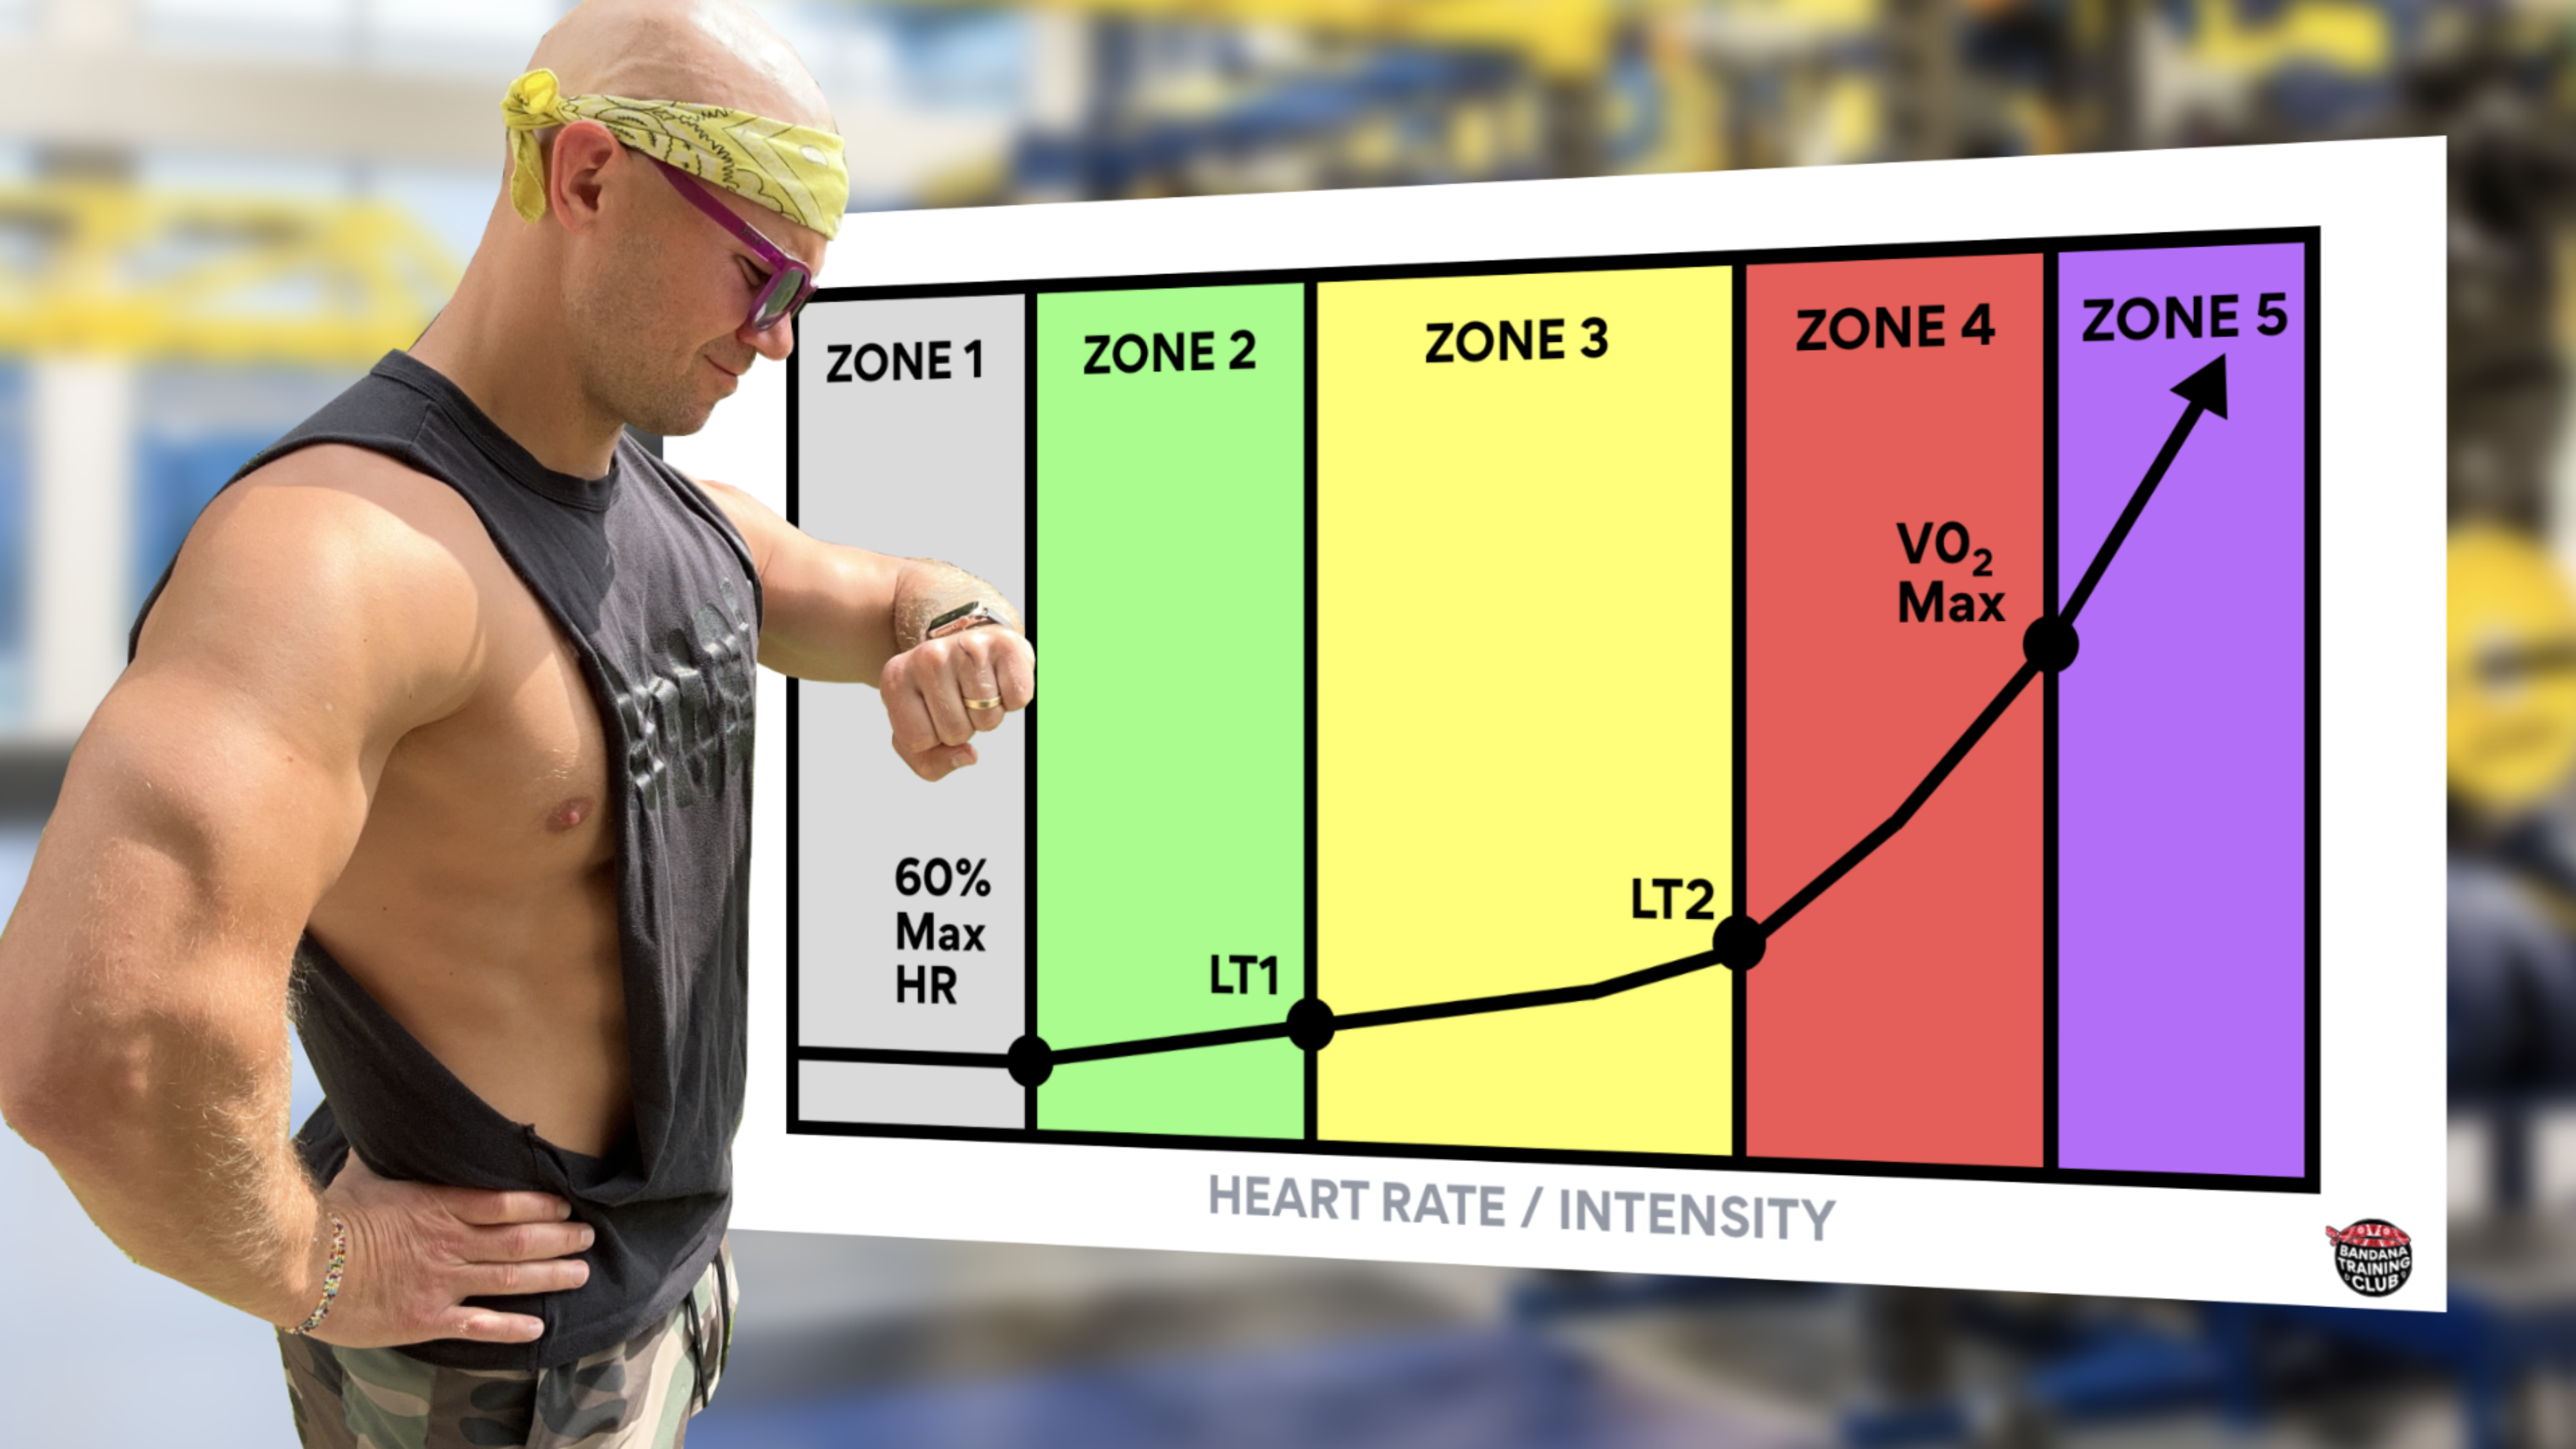
If we plot these on our cute lactate x heart rate / intensity graph, it looks something like this.
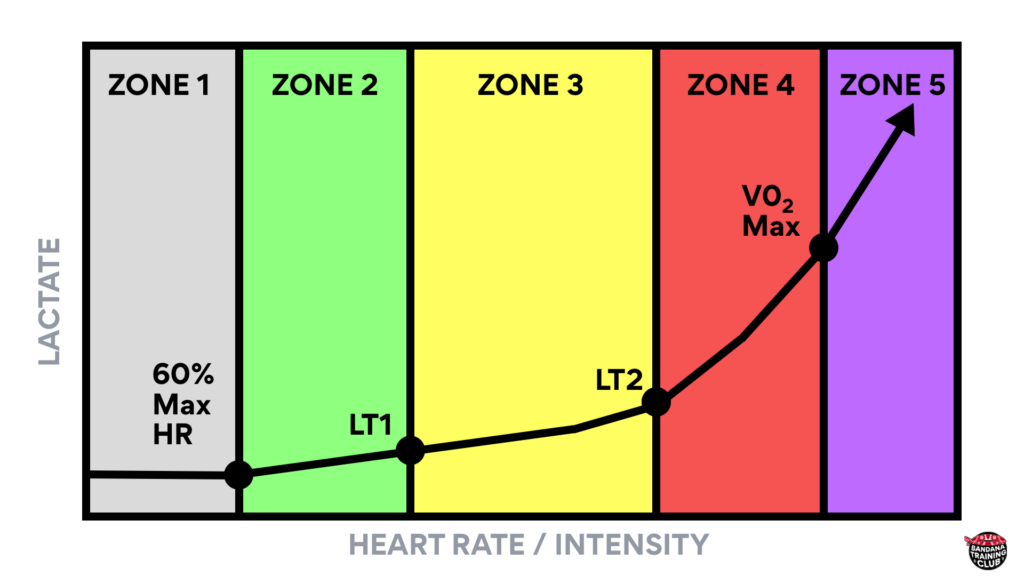
Now that’s a good looking 5 zone training graph! Glad we had this little discussion but this is only the beginning, because now the question becomes how do we use these zones to get better?
If you’re learning from these posts, please follow me on social media (links below) and consider signing up for the Bandana Training Club which contains an entire catalogue of training programs and sport science related content.
Works Cited
Casado, A., Foster, C., Bakken, M., & Tjelta, L. I. (2023). Does Lactate-Guided Threshold Interval Training within a High-Volume Low-Intensity Approach Represent the “Next Step” in the Evolution of Distance Running Training?. International Journal of Environmental Research and Public Health, 20(5), 3782. https://doi.org/10.3390/ijerph20053782
Jamnick, N. A., Pettitt, R. W., Granata, C., Pyne, D. B., & Bishop, D. J. (2020). An Examination and Critique of Current Methods to Determine Exercise Intensity. Sports Medicine (Auckland, N.Z.), 50(10), 1729–1756. https://doi.org/10.1007/s40279-020-01322-8
Jones, A. M., & Carter, H. (2000). The Effect of Endurance Training on Parameters of Aerobic Fitness. Sports Medicine (Auckland, N.Z.), 29(6), 373–386. https://doi.org/10.2165/00007256-200029060-00001
Milani, J. G. P. O., Milani, M., Cipriano, G. F. B., Hansen, D., & Cipriano Junior, G. (2023). Exercise Intensity Domains Determined by Heart Rate at the Ventilatory Thresholds in Patients with Cardiovascular Disease: New Insights and Comparisons to Cardiovascular Rehabilitation Prescription Recommendations. BMJ Open Sport & Exercise Medicine, 9(3), e001601. https://doi.org/10.1136/bmjsem-2023-001601
Sales, M. M., Sousa, C. V., da Silva Aguiar, S., Knechtle, B., Nikolaidis, P. T., Alves, P. M., & Simões, H. G. (2019). An Integrative Perspective of the Anaerobic Threshold. Physiology & behavior, 205, 29–32. https://doi.org/10.1016/j.physbeh.2017.12.015