Previously we discussed ATP, the creatine phosphate system, and anaerobic glycolysis. If you need a review, check out Understanding Energy Systems: A Coach’s Perspective Part 1. We’re going to pick up our conversation by discussing the powerhouse of energy production – our aerobic system.
Aerobic Energy Production
If our creatine phosphate system is like a sniper and anaerobic glycolysis is a Seal Team, then our aerobic energy system is like the US Army. What it lacks in speed and agility, it makes up for with force.
The anaerobic route for glycolysis was to attached pyruvate and hydrogen to produce lactate. The alternate route is to take pyruvate and ship it to the mitochondria. The mitochondria is where aerobic energy production occurs.
The Citric Acid Cycle
The citric acid cycle, known by most of us as the Krebs cycle or by super dorks as the tricarboxylic acid cycle, is the oxidation of acetyl-CoA. As we just reviewed, we can produce acetyl-CoA from glucose. We can also produce acetyl-CoA from fat through a process called beta oxidation and less commonly from protein through gluconeogenesis so there are many on-ramps to the citric acid cycle.
At the risk of overstating things, the citric acid cycle is the foundation of life as we know it. It’s even been argued that the citric acid cycle is the reason we are conscious, although that’s beyond my pay-grade (Lane, 2022).
Aerobic respiration is the most complicated of our three energy systems. You can google an info-graphic if you’re into such things but they give me PTSD from my grad courses in cellular metabolism and I don’t want to get too bogged down in the biochemistry. Here’s the equation for one glucose molecule:
2 acetyl groups + 6 NAD+ + 2 FAD + 2 ADP + 2 Pi + 2 H20 ===> 4 C02 + 6 NADH + 2 FADH2 + 2 ATP + 2 CoA
You probably skipped over the equation without reading it and I don’t blame you. I’ll tell you everything you need to know. The citric acid cycle has only produced 2 ATP from one glucose molecule which is no more impressive than anaerobic glycolysis. But its real purpose has been to produce these other electron carriers (NADH and FADH2) which are precursors for a windfall of ATP production.
Oxidative Phosphorylation
So you’re familiar with the nomenclature, oxidative phosphorylation is often broke down into the final two stage of aerobic cellular respiration – the electron transport chain (ETC) & chemiosmosis. This process happens in the inner membrane of the mitochondrion and its main purpose is to use the energy from NADH and FADH2 to create a butt load of ATP. In case you want to details, electrons move down the ETC and release energy which is used to pump protons (H+) across the inner mitochondrial membrane and then shoot them back through a large enzyme called ATP synthase in a process called chemiosmosis. This produce ATP. At the end of the road, the electrons are gained by an oxygen molecule (O) along with hydrogen (H+) to produce water (H20).
Some text books will tell you that 38 ATP molecules can be made from every glucose molecule oxidized (2 from glycolysis, 2 from the Krebs cycle, and 34 from oxidative phosphorylation). However, newer research suggests that this theoretical maximum doesn’t account for the cost of moving stuff around so current estimates are 30 or 32 ATP per glucose, depending on who you ask and apparently how they count. (Brooks, 2018; Chaudhry & Varacallo, 2023)
Let’s Summarize
The goal of all of our energy systems is to produce ATP. The creatine phosphate system is the simplest and quickest way for us to do this but is limited by the amount of creatine we can store in our muscles. Anaerobic glycolysis breaks down glucose into pyruvate. If we need energy fast and there is little oxygen present, we turn pyruvate into lactate in order to prevent our muscles from getting too acidic. With a little more time and oxygen, we ship pyruvate to the mitochondria, remove a single carbon to turn it into acetyl-CoA, run it through the Kreb’s cycle to produce some high energy electron carrier and use those to produce about 32 ATP. At the end of the road, we’ve broken down an entire glucose molecule into ATP, C02, and water. ¡Viva La Body!
The Biggest Misconception
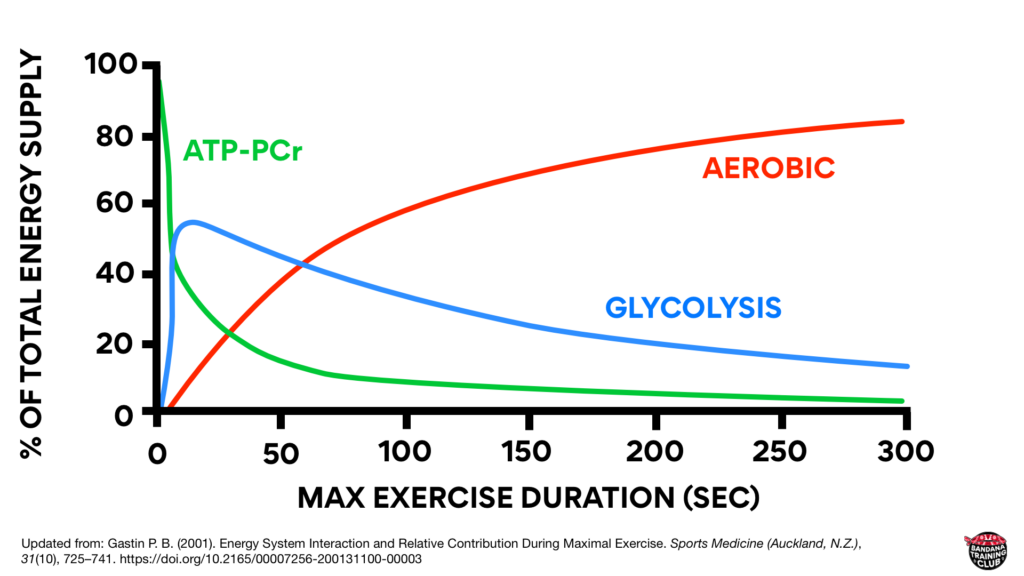
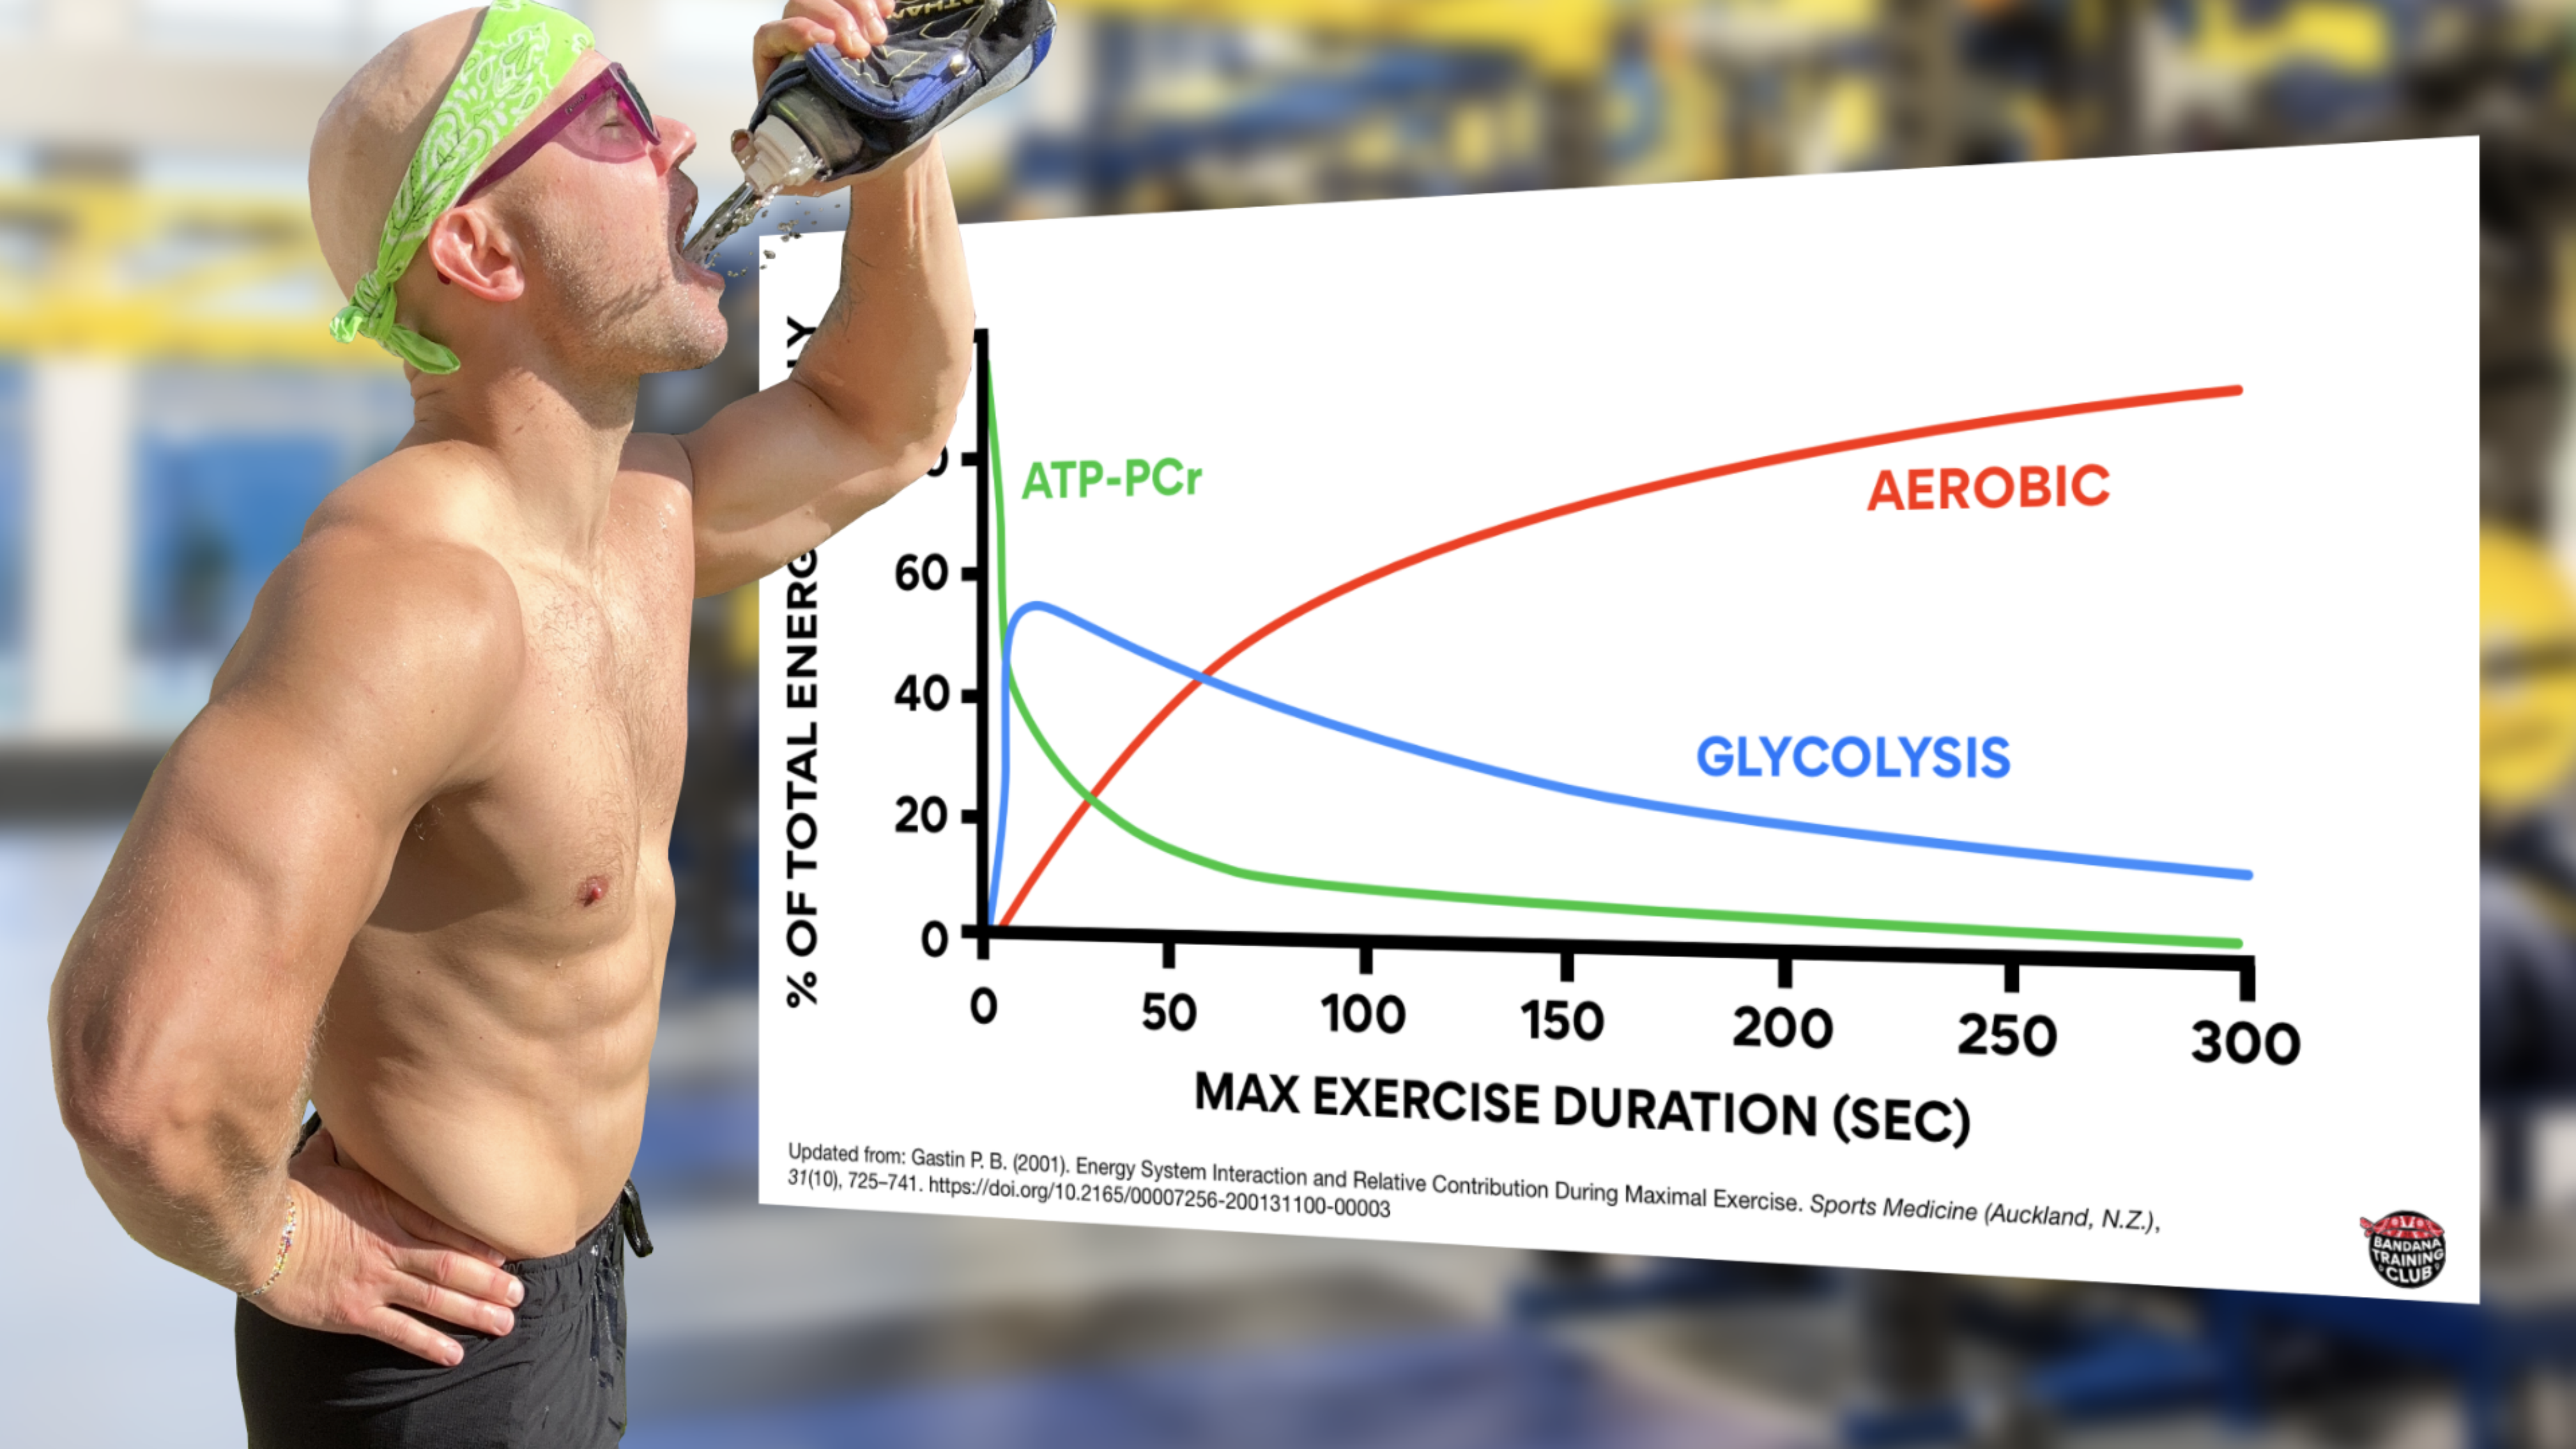
To clarify one of the biggest misconceptions about bioenergetics: none of our energy systems work in isolation. They’re all on all the time. Even at rest we’re producing a bit of lactate. Here’s a nice graph that shows how each of our three systems contribute to energy production during maximal exercise. This graph was updated from Energy System Interaction and Relative Contribution During Maximal Exercise by Gastin in 2001 to include color because when all the lines are grey, it is quite difficult to understand.

Notice that initially, the creatine phosphate system is contributing the most to energy production but its decline is quick and significant. Within seconds, glycolysis is ramping up and then gradually fading. Also notice that somewhere around the 1 minute mark (likely about 75 seconds), most energy production is coming from our aerobic system. (Gastin, 2001)
A practical example
If you got up right now and starting running as fast as you could, most of your energy would initially come from creatine phosphate but anaerobic glycolysis would quickly contribute. Somewhere around the one minute mark, you’d be producing about half of your energy from anaerobic glycolysis and half of your energy from aerobic metabolism. Beyond that, we’re able to produce more energy from our aerobic system because it’s a powerhouse and because anaerobic glycolysis produces large amounts of waste product that has to be managed.
That said, we don’t usually get up and start sprinting until we collapse (although if you do, you’re a psychopath and we would likely be friends), so we move up and down this continuum. In fact, we can essentially run anaerobic glycolysis in reverse, reproduce pyruvate from lactate and then metabolize pyruvate aerobically. We also use our aerobic system to replenish creatine phosphate so a better conditioned aerobic system will help restore our anaerobic systems quicker.
Instead of thinking in terms of separate systems, I find it helpful to imagine these systems as three gears all driving the same shaft – sort of like 3 gears on a bicycle. One is tiny and fast, one is medium, and one is big but hard to crank. They will all contribute to energy production to varying degrees, depending on our needs.
Applications for the athlete
So that’s a crash course in bioenergetics. While I happen to enjoy this level of nuance, I hope it’s clear at this point that we don’t study cellular metabolism for fun. We study cellular metabolism because a better understanding of the ways in which our athletes produce energy allows us to optimize these systems.
Here’s a nice example: the energy demands in the sport of wrestling cover the entire continuum of energy systems. Sometimes wrestlers need short explosive bouts of energy, sometimes they require sustained efforts that push well into anaerobic glycolysis (it’s been shown the lactate production in the sport of wrestling can be as high as 20 mmol/L), and an entire match is long enough to place significant demand on the aerobic system.
Because all three energy systems are pushed to the extreme, all three energy systems must be properly trained to sustain maximum energy output. Each energy system has its own training parameters and limitations. Protocols can and should be built around optimizing them. For wrestlers, this would include a combination of aerobic training, anaerobic lactic power and capacity training, and anaerobic alactic power and capacity training – which together would provide a comprehensive conditioning program to elicit maximum energy production for the sport. For wrestlers, the ability to outwork your opponent can win a lot of matches…and that’s how you win championships.
If you’re learning from these posts, please follow me on social media (links below) and consider signing up for the Bandana Training Club which contains an entire catalogue of training programs and sport science related content.
Works Cited
Brooks G. A. (2018). The Science and Translation of Lactate Shuttle Theory. Cell Metabolism, 27(4), 757–785. https://doi.org/10.1016/j.cmet.2018.03.008
Chaudhry R, Varacallo M. (2023). Biochemistry, Glycolysis. In: StatPearls. StatPearls Publishing, Treasure Island (FL); PMID: 29493928.
da Costa, C., & Galembeck, E. (2016). The Evolution of the Krebs cycle: A Promising Subject for Meaningful Learning of Biochemistry. Biochemistry and Molecular Biology Education : a Bimonthly Publication of the International Union of Biochemistry and Molecular Biology, 44(3), 288–296. https://doi.org/10.1002/bmb.20946
Gastin P. B. (2001). Energy System Interaction and Relative Contribution During Maximal Exercise. Sports Medicine (Auckland, N.Z.), 31(10), 725–741. https://doi.org/10.2165/00007256-200131100-00003
Lane, Nick. (2022). Transformer: The Deep Chemistry of Life and Death. W. W. Norton & Company. ISBN: 0393651487.
Meyer R.A. & Wiseman R.W. (2012). The Metabolic Systems: Control of ATP Synthesis in Skeletal Muscle. ACSM’s Advanced Exercise Physiology. 2nd ed. Philadelphia, PA: Wolters Kluwer, 363–378.
Peek, C. B., Levine, D. C., Cedernaes, J., Taguchi, A., Kobayashi, Y., Tsai, S. J., Bonar, N. A., McNulty, M. R., Ramsey, K. M., & Bass, J. (2017). Circadian Clock Interaction with HIF1α Mediates Oxygenic Metabolism and Anaerobic Glycolysis in Skeletal Muscle. Cell Metabolism, 25(1), 86–92. https://doi.org/10.1016/j.cmet.2016.09.010

